Landing Page Optimization: An Engineering Playbook for Shipping Experiments, Not Opinions
A developer's guide to landing page optimization: instrument, triage friction, score with ICE, test with A/B testing, and ship via PR.
You shipped the feature, published the announcement, and watched qualified traffic keep arriving. Trial signups haven't moved for two quarters. Every review ends with another opinion about the headline, hero illustration, or CTA color, while the actual page stays unchanged.
That isn't a copywriting problem. It's a shipping problem. Landing page optimization works when the team can observe a bottleneck, form a falsifiable hypothesis, implement a narrow change, review the code, and read the result through A/B testing against one business metric. Here's why this deserves engineering attention: the Unbounce benchmark dataset analyzed 41,000 landing pages, 464 million visitors, and 57 million conversions in Q4 2024, finding a 6.6% median conversion rate across industries. The top 10% converted at 11.7% or higher, so the difference between an average page and a strong one compounds at meaningful traffic volume.
Why Most Landing Pages Plateau and How to Spot It
Trial signups stay flat while the team debates hero images. Traffic remains steady, acquisition channels still run, and the product has something worth promoting. In the dashboard, the page appears healthy. The stalled outcome is easier to spot in the gap between page activity and the business event that matters.
The same argument returns because page changes are disconnected from a controlled delivery process. Audits collect dust in Notion, screenshots circulate in Slack, and developers eventually receive a vague request to "make the page convert better." Without a clear owner, hypothesis, and PR, the page changes slowly while opinions multiply.
Four signs the page has stopped learning
- Copy changes no longer move signups. Headlines and supporting copy have changed several times, but the north star event remains flat. The constraint may be speed, trust, or form completion rather than wording.
- Visitors disappear before the offer is understood. A sharp drop in the first scroll quartile points toward a first-viewport problem. Rewriting the long-form argument will not fix a page that loses visitors before they reach it.
- Mobile behaves materially worse than desktop. A mobile bounce rate that exceeds desktop by 20% or more is a useful diagnostic threshold for checking layout, speed, tap targets, and form behavior. Treat it as a triage signal, not a universal benchmark.
- Nobody can name the metric being optimized. One person reports CTA clicks, another reports demo submissions, and a third reports activated accounts. The team then cannot agree on whether a variant worked.
A plateau needs a small engineering loop. Instrument the page, classify the evidence, write a falsifiable hypothesis, implement one narrow change, merge it through a pull request, and publish the result against one business metric. That sequence makes the work reviewable and prevents a redesign from hiding a simpler defect, such as a render-blocking script delaying the first useful interaction or a form requesting information enterprise visitors do not yet trust you with.
Use this CRO framework as the operating sequence:
- Instrument the page and define the north star.
- Triage friction into speed, clarity, trust, or form.
- Hypothesize one change with a measurable outcome.
- Test and ship the smallest implementation that isolates the idea.
- Report the result and queue the next decision.
A plateau is a diagnosis to investigate, not a reason to start another redesign thread.
Instrument the Page Before You Touch a Single Line of Copy
Install analytics and define the north star before any copy change begins. Add a PostHog or Plausible snippet to every relevant pageview, a lightweight session recorder such as Hotjar or OpenReplay, and Core Web Vitals collection through web-vitals.js. Send performance events to the same analytics destination as conversion events. A developer can then connect a slow release with a conversion change without reconciling three dashboards.
Choose one north star event. A self-serve SaaS page will usually use trial_started; a sales-assisted funnel may use demo_requested. Keep them from competing as primary outcomes. A CTA click does not prove that someone started a trial, and a submitted lead form does not prove that the lead became a qualified opportunity. Select the event closest to the business outcome the page is built to create.
Keep secondary signals limited and purposeful:
hero_cta_clickshows whether the first offer earns interaction.pricing_section_viewshows whether visitors reach the commercial explanation.scroll_50indicates whether the page holds attention through its middle.form_field_focusreveals intent before submission or abandonment.
Tag experiment traffic with one consistent utm_campaign value, such as lp_pricing_form_v3. Preserve it through A/B routing and signup redirects. If the client, server, and CRM encode the variant differently, the readout will split one experiment into several incomplete records.
The one-screen weekly baseline
Use a shared report that fits on one screen. Its job is to make the same questions answerable each week, not to model every possible interaction.
| Baseline field | What to record |
|---|---|
| Traffic | Sessions by source and device |
| North star | trial_started or demo_requested conversion rate |
| Scroll behavior | Scroll depth quartiles |
| Performance | Median LCP and notable regressions |
| Exit point | Highest-volume exit element |
| Experiment state | Control, variant, runtime, owner |
Separate email, paid search, organic, and partner traffic before comparing results. The Shopify landing page benchmark overview reports that email traffic can convert at 19.3%, while SaaS pages have a 3.8% median and financial services pages an 8.4% median. Treat those figures as context, not as targets to paste into the dashboard. Traffic intent and audience fit can make the same page perform very differently.
Before the first copy change, verify five operating details:
- Snippet installed: Pageview, conversion, and performance events fire in production.
- Names documented: The event dictionary lives beside the code.
- Dashboard shared: The founder, developer, and growth owner use the same URL.
- Baseline captured: Record 14 days of baseline data before interpreting a new variant, unless traffic volume or an urgent production issue calls for a different decision.
- Owners assigned: One person owns instrumentation, one owns implementation, and one owns the readout.
Triage Friction Into the Four Buckets That Matter
A useful triage system turns scattered complaints into an owner and a next action. Put every finding into exactly one bucket: speed, clarity, trust, or form. If an issue seems to belong everywhere, classify it by the first user failure it causes.
The four buckets
| Bucket | Key Signals | Detection Threshold | Typical SaaS Symptom |
|---|---|---|---|
| Speed | LCP, INP, render-blocking scripts, hero asset weight | LCP above 2.5s or INP above 200ms | The page feels late before visitors can evaluate the offer |
| Clarity | Scroll quartiles, CTA clicks, message match | CTA click rate under 3% | Visitors can't tell who the product is for or what happens next |
| Trust | Pricing-section exits, bounce, proof visibility, security language | Time on page under 30 seconds combined with high pricing-section bounce | Visitors hesitate when the commercial or risk details appear |
| Form | Field focus, validation errors, abandonment | Focus events followed by no submission | Prospects start the form but encounter effort or uncertainty |
These thresholds are triage triggers, not universal laws. A developer should inspect the page and segment the data by device, source, and intent before calling an issue causal. A low CTA click rate from broad informational traffic may reflect poor audience fit, while the same rate from a tightly matched product query points more strongly to clarity.
A worked pricing-page diagnosis
Suppose a SaaS pricing page produces a 1.8% demo rate. The dashboard shows 4.1s LCP, a hero that doesn't explain the difference between starter and enterprise plans, and a six-field form that asks for company size before showing a price. The page has at least three plausible bottlenecks:
- Speed: The 4.1s LCP puts the first meaningful product or offer view behind a performance delay. Inspect the hero image, render-blocking scripts, font loading, and third-party widgets.
- Clarity: Visitors can't identify the correct plan path because starter and enterprise positioning is blended together. Separate the audiences and align each CTA with the next step.
- Form: Company size is requested before the visitor sees pricing. Test whether deferring that field or moving it after an initial qualification step reduces abandonment.
Don't bundle all three changes into one redesign. Create an issue log with one row per finding, one bucket, one evidence link, and one owner. The first sprint might address LCP, while the clarity and form issues remain separate hypotheses. That gives the team a readable result instead of a page-wide change with no explanation for the outcome.
Practical rule: A symptom can have several causes, but an experiment should test one cause at a time.
Turn Bottlenecks Into a Ranked Experiment Backlog
Take the three highest-value findings from triage and rewrite each as a falsifiable statement. The useful format is:
We believe [change] will improve [metric] because [behavioral insight from the signal].
For the pricing page, that might produce three separate cards:
- We believe compressing and priority-loading the hero asset will improve
demo_requestedbecause visitors currently wait through a 4.1s LCP before evaluating the offer. - We believe separating starter and enterprise messaging will improve
demo_requestedbecause the current page doesn't match the visitor's buying path. - We believe removing company size from the first form step will improve
demo_requestedbecause visitors focus fields and abandon before submission.
Score each card with ICE. Give Impact a score from 1 to 10 based on the likely effect on the north star, Confidence a score from 1 to 10 based on the strength of your evidence, and Ease a score from 1 to 10 based on implementation effort and risk. Multiply the three values for a single priority score, then sort the backlog descending.
ICE scorecard for landing page hypotheses
| Hypothesis | Impact | Confidence | Ease | ICE Total | Guardrail Metric |
|---|---|---|---|---|---|
| Compress and priority-load hero asset | 8 | 8 | 7 | 448 | Time-to-first-value |
| Separate starter and enterprise paths | 9 | 6 | 5 | 270 | Qualified demo rate |
| Remove company size from first form step | 7 | 7 | 8 | 392 | Sales qualification quality |
The arithmetic isn't scientific precision. It is a forcing function that makes assumptions visible. In this example, the speed hypothesis ranks first, the form hypothesis second, and the messaging change third. The team should still review whether the chosen sprint fits the current release constraints, but it shouldn't select the idea because the loudest person prefers it.
Choose one guardrail metric that protects the product or revenue experience. If the north star is trial starts, use time-to-first-value, activation completion, or support ticket volume as the opposing check. If more demo submissions create low-quality conversations, use qualification quality as the guardrail. A conversion lift that damages onboarding or sales efficiency isn't a win.
Write the hypothesis, ICE scores, chosen guardrail, event names, and rollback condition on one card before design begins. Everything else stays in the permanent backlog. This makes it easier to kill a low-confidence bet without turning the decision into a debate about whose idea lost.
Design and Read an A/B Test Without Lying to Yourself
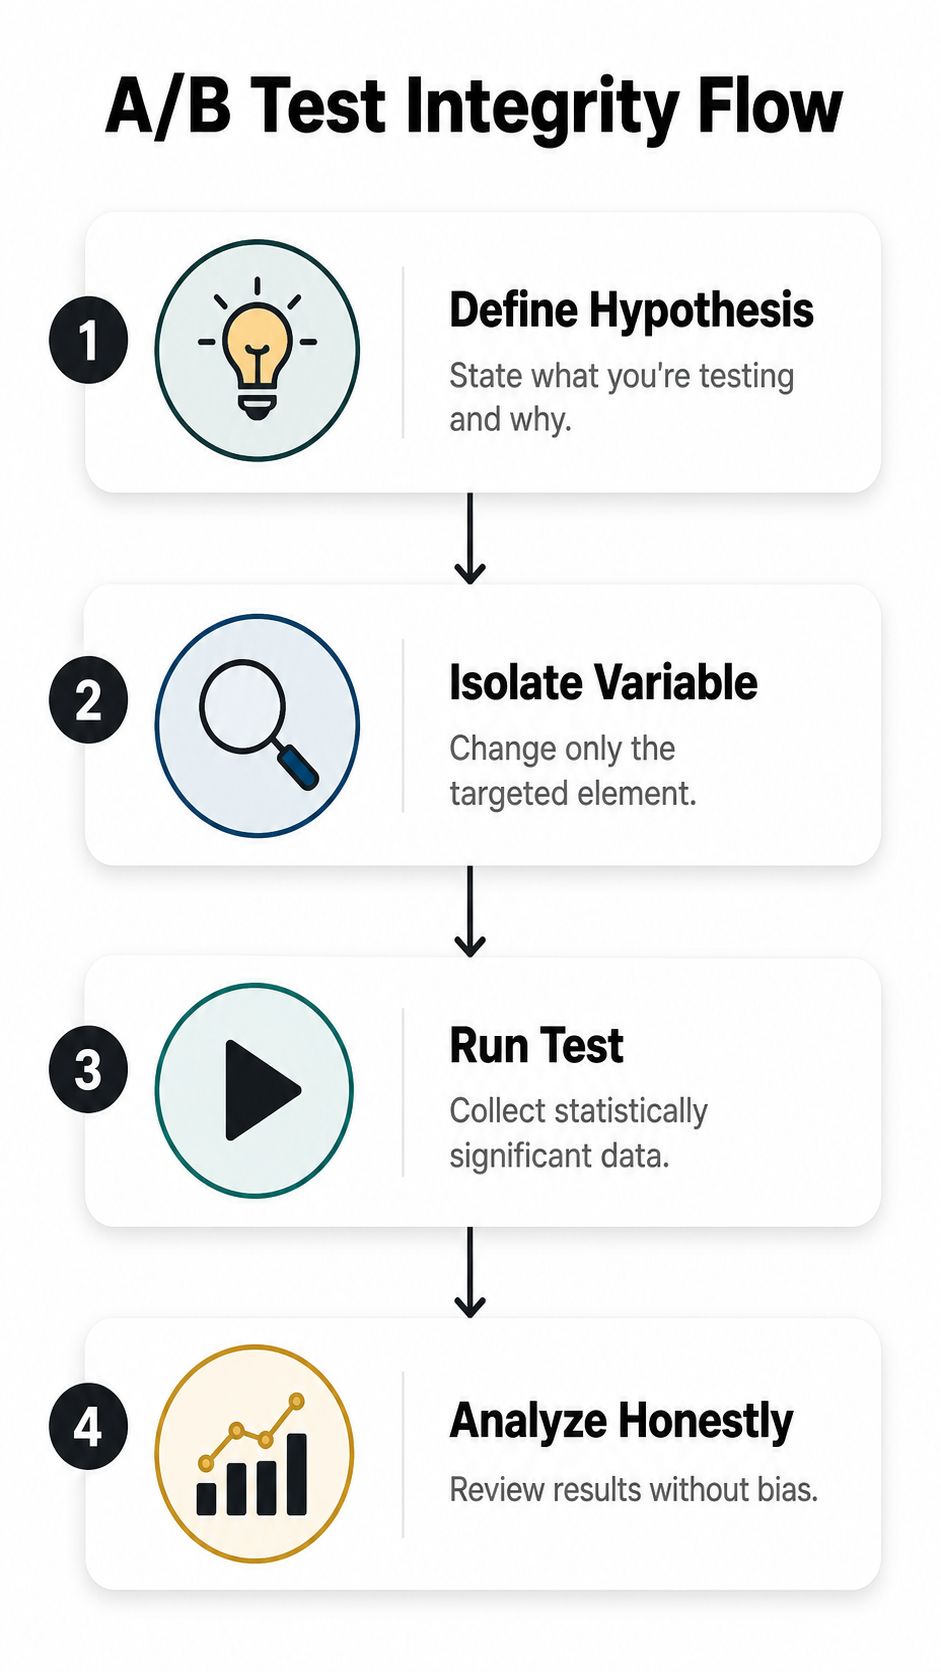
Define the variant boundary before writing code. If the hypothesis concerns social proof, the control and variant should differ only in the testimonial block. If it concerns form friction, keep the hero, pricing layout, and chat widget unchanged. A narrow test protects attribution and produces a diff that reviewers can inspect.
Estimate the minimum detectable effect from the current north star conversion rate and the improvement worth shipping. Use a standard proportion-test sample-size calculator to set the required sample per variant. Record the baseline rate, desired power, significance threshold, and practical lift before splitting traffic. The calculator is only as reliable as those inputs.
Choose a fixed runtime or a documented Bayesian posterior threshold. Do not check the dashboard every few hours and stop when the chart looks favorable. Repeated peeking converts random movement into a launch decision, particularly on small SaaS pages where conversions vary by source and day.
A compact interpretation rule
Report four items together:
- Point estimate: The observed difference between control and variant.
- Interval: The confidence or credible interval around that estimate.
- Practical significance: Whether the likely outcome justifies shipping and maintenance cost.
- Guardrail result: Whether activation, qualification, support load, or another protected metric worsened.
An interval crossing zero makes the result inconclusive, not a victory. If the guardrail worsens, classify the outcome as negative even when the north star improves. Pre-register the primary metric and analysis plan in the experiment card, then archive the variant when it fails the agreed rule.
The SEO experimentation workflow from Orchory applies the same discipline: define the change, ship it through a reviewable workflow, and connect the result to the next decision. A landing page test should leave behind a decision record that another engineer can audit and use.
Keep the four-part summary beside the experiment card and code review. That record is more useful than a video because it ties the observed lift, uncertainty, business trade-off, and guardrail outcome to the exact change that shipped.
Ship the Variant Through a Coding Agent and a Real PR
A winning variant is product code. It needs a diff, tests, ownership, and a rollback path. Don't hand a designer's screenshot to an engineer and ask them to reproduce the page from memory. Give a coding agent the exact scope and ask for a minimal change.
Paste a prompt like this into Claude Code or Cursor:
Update the landing page at
[page URL or repository route].Targeted element:
[one element].Hypothesis:
[change]will improve[north star event]because[observed signal].Implementation: modify only
[HTML/CSS/JS or component]. Preserve existing responsive behavior, accessibility semantics, metadata, analytics events, and unrelated copy. Generate a focused diff, not a full-page rewrite.Analytics: keep
[control event], add or update[variant event], and attach experiment identifier[experiment name]. Confirm the event fires once at the intended interaction.Acceptance criteria:
[specific visual and behavioral checks].Performance constraints: don't add a blocking script, don't increase the hero asset weight, and report any bundle or LCP impact.
Rollback: gate the change behind
[feature flag or configuration], document the control state, and make reversal possible with one deploy.Before finishing, run the relevant tests and return the changed files, test output, event verification, and rollback instructions.
The agent should return a diff you can inspect. If it rewrites the entire page, stop and narrow the prompt. Large diffs hide accidental changes to canonical tags, structured data, navigation, form validation, and analytics.
Pull request checklist
Open a PR with a title such as Test enterprise plan split against demo-request hypothesis. The description should include:
- Hypothesis: The exact statement from the ICE card.
- Expected outcome: The north star event and intended direction.
- Guardrail: The metric that must not regress.
- Scope: The single element changed.
- Analytics plan: Event names, variant identifier, and dashboard.
- Rollback: Feature flag, revert commit, or configuration switch.
- Review links: ICE card, baseline report, and experiment plan.
A human reviewer should check selector specificity, mobile layout, keyboard navigation, screen-reader labels, form behavior, page weight, and event naming consistency. CI should pass before merge, and someone should verify the rollback path in the deployed environment.
The AI SEO agent workflow at Orchory follows a similar handoff model for search pages, producing prompts that coding agents can execute while repository control remains with the team. For conversion rate optimization (CRO), the same PR-first boundary keeps marketing changes auditable and reversible.
Report Results and Feed the Backlog for the Next Sprint
An experiment isn't complete when the dashboard shows a green arrow. Write a one-page report that records what changed, when it ran, which traffic segments were included, the north star result, the interval, the guardrail result, and the decision. Use only three decisions: ship, iterate, or kill.
Segment cuts should answer practical questions, not search for a favorable slice. Compare device, source, new versus returning visitors, and relevant intent groups when those segments were defined before analysis. A variant that wins on desktop but harms mobile needs a product decision, not a blended average that hides the regression.
Monthly CRO review template
| Section | What to Record |
|---|---|
| Results table | Control, variant, runtime, sample definition, point estimate, interval |
| Decision | Ship, iterate, or kill, with owner and merge or archive date |
| Learnings | What the result says about speed, clarity, trust, or form |
| Segment cuts | Predefined device, source, and intent comparisons |
| Guardrails | Activation, qualification, support, or time-to-value outcome |
| Next hypotheses | The next three cards from analytics and user feedback |
Hold the review on a fixed monthly cadence, but groom the backlog weekly. Retire dead ideas with the reason they failed. Promote winning patterns only when the result supports a specific mechanism, such as clearer plan separation or less form friction, rather than copying a button style across unrelated pages.
User feedback belongs in the same queue as analytics. Add sales call objections, support conversations, session-recording observations, and form abandonment notes to the issue log. A repeated objection about security belongs in the trust bucket. A repeated question about which plan fits belongs in clarity. The classification keeps qualitative evidence actionable.
The habit that compounds is small: reserve 30 minutes every Friday for someone to write the next hypothesis, even when the previous experiment lost. That appointment keeps the page from returning to opinion-driven redesigns. Over time, the backlog becomes infrastructure for SaaS growth, and each merged PR leaves behind a clearer record of what your audience responds to.
Orchory maps search intent, clusters keywords, scores page opportunities, and turns the selected opportunity into a ready-to-run prompt for a coding agent, including page scope and acceptance criteria. Visit Orchory to connect your SEO planning with the same PR-first workflow you use to ship and improve landing pages.
FAQs
What is a good landing page conversion rate to benchmark against?
What are the four buckets used to triage landing page friction?
How does ICE scoring work for prioritizing landing page experiments?
How long should an A/B test run before reading the results?
What should a pull request for a landing page variant include?
What is a guardrail metric and why does it matter?