How to Find Growth Factor: Formulas, Code, and Edge Cases
Learn how to calculate growth factor, compound growth, and CAGR with formulas, Python, SQL, and spreadsheet snippets, plus the edge cases that break the math.

You're staring at a weekly organic sessions chart or an MRR spreadsheet that inches up, and you want one clean number that says what changed. Not a vague trend, not a dashboard full of arrows, just the factor you can paste into a report, compare next week, and trust when the numbers refresh.
What Growth Factor Actually Means in Practice
If you track organic sessions, MRR, or conversion counts in a spreadsheet, growth factor is the ratio between the ending value and the starting value. It tells you how many times larger or smaller the new value is, without dressing it up as a percent. A factor of 1.0 means flat, above 1.0 means growth, below 1.0 means decline.
That distinction matters because people mix up ratio math and percentage math all the time. A 1.4x weekly change and a 1.4x annual change are not remotely the same story, even though they use the same multiplier. In SEO reporting, that mistake shows up when someone compares a weekly content test to a year-long traffic trend and treats both as interchangeable.
The three versions you actually use
Single-period growth factor answers a simple question, like, "What happened from last month to this month?" Compound growth chains multiple periods together, which is what you want when you care about a run of weekly or monthly steps. CAGR, or compound annual growth rate, smooths a multi-period run into one annualized factor for board decks, investor updates, or any summary where time spans differ.
Practical rule: if the report needs one number for one step, use a single-period factor. If the report covers several periods, decide whether the reader needs the true compounded path or the smoothed annual rate.
For SEO and product work, the right version depends on the decision being made. A founder reviewing a content sprint might want the period-over-period factor. A developer building a performance table for leadership usually needs the annualized version because it's easier to compare across quarters and products.
Single-Period Growth Factor Step by Step
Start with the simplest case, one start value and one end value. The formula is final value divided by initial value. If organic sessions moved from 4,200 to 5,880, the growth factor is 5,880 / 4,200 = 1.4.
That factor means the new value is 1.4 times the old one. Converted to percentage growth, it's 40 percent because 1.4 - 1 = 0.4. In practice, I use the factor when I want to compare ratios and the percent when I'm writing for people who think in increase or decrease terms.
Spreadsheet syntax you can paste
In Excel, use =B2/A2 if B2 is the final value and A2 is the initial value. In Google Sheets, the same formula works, =B2/A2. If you want the percentage growth instead, wrap it as =(B2/A2)-1, then format the cell as a percent.
A quick way to read the result:
- Above 1.0: the series grew.
- Exactly 1.0: the series stayed flat.
- Below 1.0: the series shrank.
Use the ratio when you need a multiplier, use the percent when someone asks how much it changed.
The one assumption here is easy to miss, the starting value can't be zero. Once the baseline is zero, the formula stops being a ratio and becomes a division problem. That edge case needs a different treatment, and it shows up more often than people expect in low-volume SEO pages and early product funnels.

Compound Growth and CAGR for Multi-Period Data
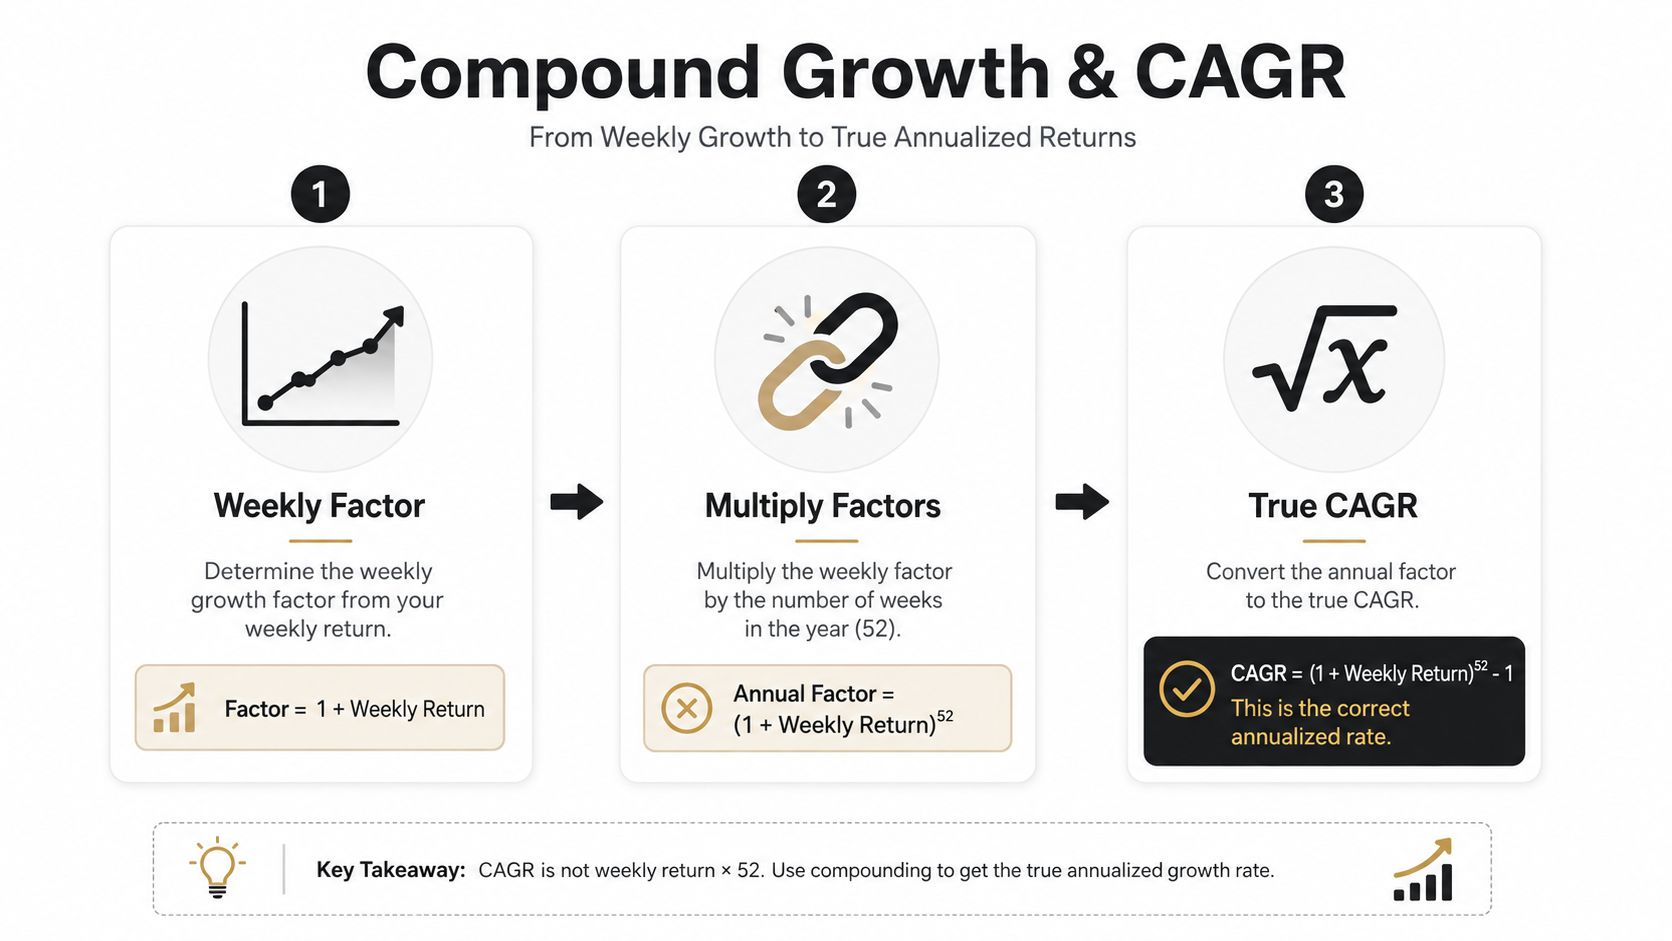
Once you have more than one period, the simple ratio is no longer enough. A sequence of weekly or monthly changes has to be compounded, because each period builds on the last one. That's why multiplying period-over-period factors gives the true multi-period growth path, while CAGR compresses that path into one annualized number.
Compound the factors first
If you have period factors of 1.10, 1.05, and 1.20, the compounded growth factor is 1.10 × 1.05 × 1.20 = 1.386. That means the series ended at 1.386 times its starting point across the full span. This is the number to use when you care about the actual cumulative path, not a smoothed summary.
CAGR answers a different question. It asks, "If this same change happened at a steady rate each year, what would that annual factor be?" The formula is:
CAGR = (final value / initial value)^(1 / number of periods) - 1
If revenue moved from 100 to 171.5 over three years, the compounded factor is 171.5 / 100 = 1.715. The CAGR is (171.5 / 100)^(1/3) - 1, which gives the annualized rate that would reach the same endpoint over three equal steps.
When the two numbers diverge
They diverge because CAGR smooths volatility. A business can have a bumpy year with uneven quarter-to-quarter factors, but CAGR hides the bumps and reports one clean annual rate. That's useful for comparing businesses or portfolios, but it can also hide the timing of a bad quarter or a late SEO lift.
Board math should be boring. If the audience wants one comparable number, CAGR is usually the right choice. If the audience needs to debug the path, show the period factors too.
In spreadsheets, CAGR is usually =(B2/A2)^(1/n)-1, where n is the number of periods. For yearly data, n is the number of years. For monthly data, convert carefully before you annualize, because the exponent only makes sense when the period count matches the time span.
Programmatic Snippets for Real Datasets
Manual formulas work for one row. Real SEO and product data usually live in a column with missing weeks, nulls, and rows that should not be compared at all. That's where a small helper in Python, a sheet formula, or a warehouse query saves time and keeps the definition consistent.
Python for period factors and CAGR
def growth_factors(values):
    factors = []
    for prev, curr in zip(values, values[1:]):
        if prev in (None, 0):
            factors.append(None)
        else:
            factors.append(curr / prev)
    return factors

def cagr(start, end, periods):
    if start in (None, 0) or periods <= 0:
        return None
    return (end / start) ** (1 / periods) - 1
The first function returns a list of period-over-period factors and skips invalid bases instead of crashing. The second gives you a single annualized rate. In notebook work, I usually keep both, because the factor list is what I use to debug outliers and the CAGR is what I use to summarize.
Google Sheets across a whole column
If your values start in B2, this pattern computes growth factor row by row:
=ARRAYFORMULA(IF(OR(B2:B="",B1:B=""), B2:B/B1:B))
That version is simple, but it assumes adjacent rows belong to adjacent periods. If you have missing weeks, sort and fill your date spine first. Otherwise, you'll divide one active week by a row from a completely different interval and the result will look real while being wrong.
SQL for warehouse metrics
A window function handles the same job cleanly:
SELECT
  period,
  metric,
  metric / LAG(metric) OVER (ORDER BY period) AS growth_factor
FROM metrics;
For a working example of how this kind of metric ties into execution, see the internal workflow in SEO for Developers. The point is not just to calculate the ratio, it's to make sure the same rule runs every refresh.
| Tool | Single-period formula | CAGR formula | Notes |
|---|---|---|---|
| Excel | =B2/A2 |
=(B2/A2)^(1/n)-1 |
Good for quick checks and shared sheets |
| Google Sheets | =B2/A2 |
=(B2/A2)^(1/n)-1 |
Easy to extend with ARRAYFORMULA |
| Python | curr / prev |
(end / start) ** (1 / periods) - 1 |
Best when you need validation and edge-case handling |
| SQL | metric / LAG(metric) |
Usually computed outside SQL or with period math | Best for warehouse-stored reporting tables |
Edge Cases That Break Naive Calculations
The formula is clean until the data stops being clean. Negative baselines, zero values, tiny denominators, and wild swings all make the ratio look more precise than it is. If you ship the wrong interpretation into a dashboard, the number stays technically correct and practically useless.
Negative and zero baselines
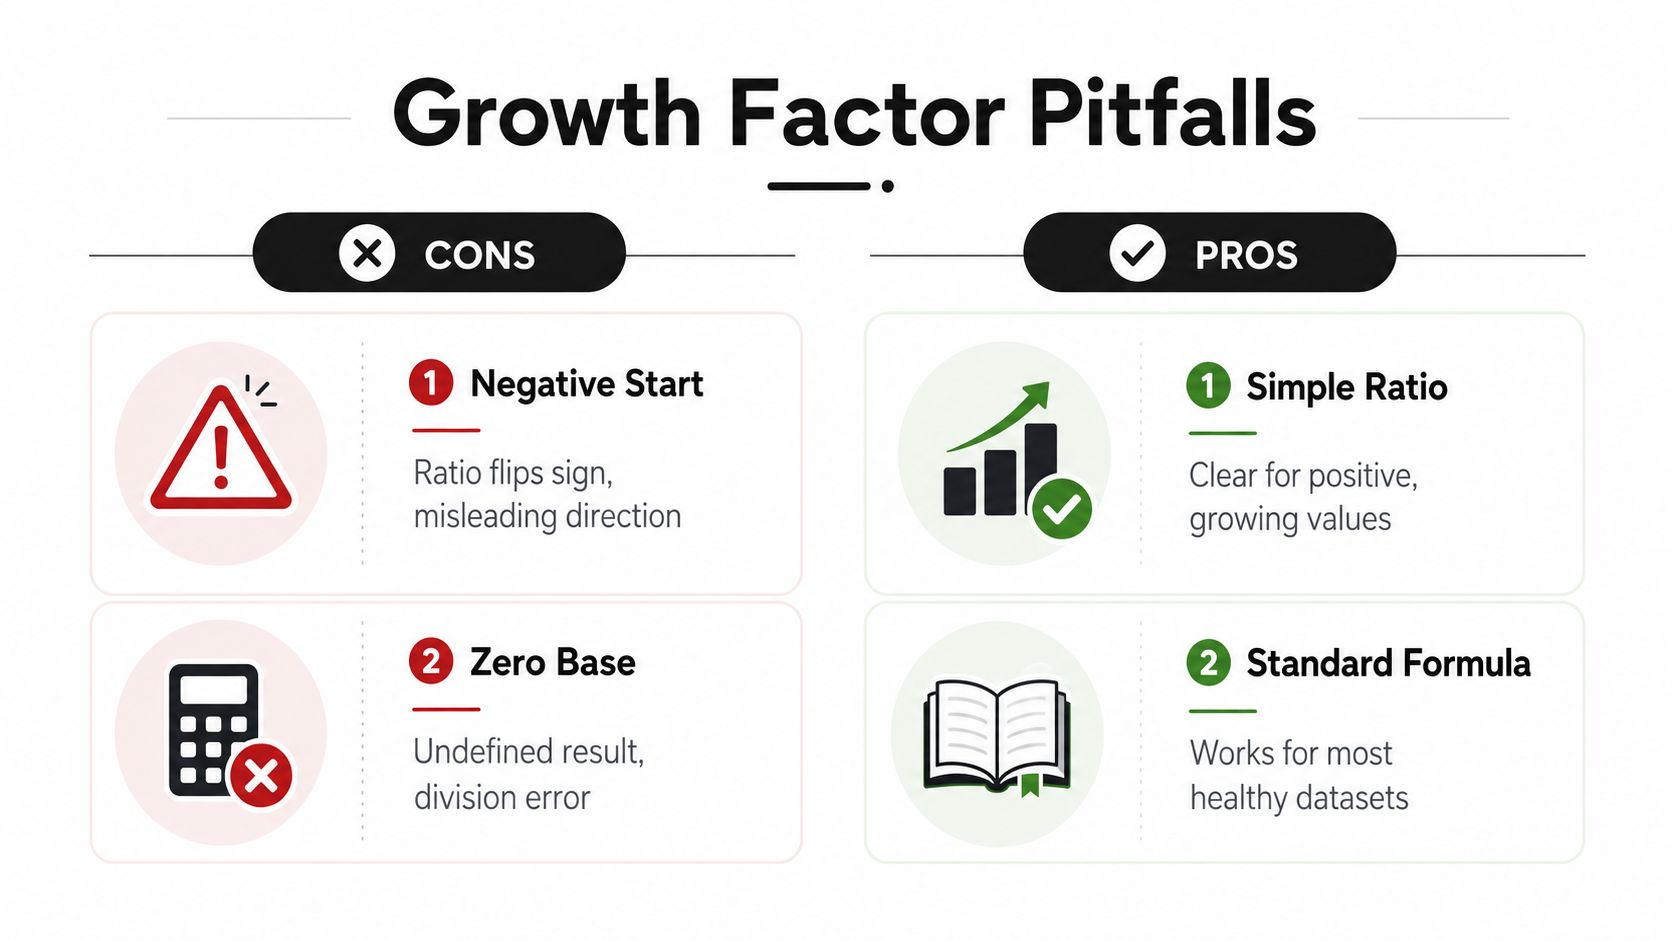
A negative starting value flips the direction of the ratio. If you divide a current positive value by a negative baseline, the sign tells you the algebra worked, not that the business grew in a meaningful sense. In that case, absolute change is usually clearer than a growth factor.
Zero is more straightforward. The ratio is undefined because division by zero has no usable result. For SEO, this often shows up in brand-new pages, pages with no prior clicks, or product events that just started tracking.
If the baseline is zero or negative, don't force a growth ratio to tell a story it can't support.
Very small denominators and big swings
A denominator that is barely above zero can explode the factor. That makes a tiny change look like massive growth, even when the underlying activity is noise. I usually set a minimum threshold for the baseline and treat anything below it as a separate bucket.
Large swings cause a different problem. The math is valid, but the chart becomes hard to read and downstream averages get dominated by a few extreme rows. For that kind of series, pair the factor with absolute change and inspect the raw values before you summarize.
Choosing the Right Metric for Your Report
Growth factor fits reports that need a clean multiplier and a stable baseline. Percentage growth works better when the audience wants a plain-language change story. Absolute change wins when the starting point is tiny, zero, or negative, because the ratio stops being reliable.
For SaaS reporting, I use growth factor in a working sheet or model first, then decide how to present it. If the question is, "How did organic sessions move between two snapshots?", factor and percent both work. If the question is, "How much new pipeline did the page group create?", absolute change usually gives the clearest answer. If the question is, "How do we compare this quarter with last quarter's plan?", ratio-to-baseline is the right frame.
A simple checklist keeps the number honest before you publish it:
- Check the baseline: make sure it is not zero or negative.
- Confirm the period: weekly, monthly, and annual factors are not interchangeable.
- Decide the audience: operators often want the factor, executives often want the smoother summary.
- Lock the formula in code: do not let a sheet change the math on a later refresh.
For SaaS-specific metric guidance, see our guide on SEO for SaaS companies.
If you are shipping SEO work, Orchory can help turn keyword research and topic clustering into a ranked queue of page opportunities, so the metric you choose stays connected to what you build. If the number does not help you pick the next page, it is just decoration.
If you want this kind of math tied to a repeatable SEO workflow, visit Orchory. It helps teams turn research into prioritized page opportunities and keep the calculation, the content plan, and the handoff in sync.
FAQs
What is the formula for growth factor?
How is growth factor different from percentage growth?
How do you calculate CAGR from a growth factor?
Why can't you calculate growth factor with a zero baseline?
When should I use compound growth instead of CAGR?